Visualising Point Clouds in Unity by Height and Intensity

ArcelorMittal Orbit

For some time there has been a free point cloud viewer available on the Unity asset store. While I was learning about the capture and processing of LiDAR data for my PhD I used the package repeatedly to visualise my data. I also made several changes to the code but couldn’t determine who the author was and whether the code had a licence. Recently I managed to get in touch with the author Gerard Llorach who kindly agreed to set up a repository for the project on GitHub with an open MIT licence. I’ve now created my own fork of the project with my updates which you can clone or download from the following location:

https://github.com/virtualarchitectures/Unity-Point-Cloud-Free-Viewer

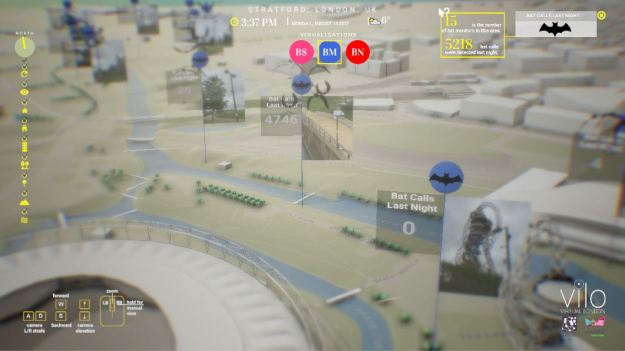
While the free point cloud viewer was originally designed to visualise point clouds photorealistically using RGB values, I found that many of the raw point clouds I was using did not come with RGB values. However, they were rich with other information such as the return intensity of each point and its height which can be used to determine the height of buildings for generating 3D urban datasets. In order to be able to visualise these properties I updated the point cloud viewer to be able to access the and visualise them using colour gradients. You get a sense of the effect in my screenshot above of the ArcelorMittal Orbit tower on the Queen Elizabeth Olympic Park in London. Post processing effects and shaders can be used to further manipulate the visualisation in Unity.

My code currently assumes that a comma delimited XYZ file with an .xyz extension will be provided. The code also anticipates a file containing up to seven columns of data in the format XYZRGBI (where I is intensity). At present you need to manually check your files to determine min and max values for Height and Intensity, if you intend to use those features. Be prepared to adjust the code to suite your data if necessary.

Personally I love the abstract look this gives the point clouds, especially when viewed in Virtual Reality. There are a number of great projects which use point clouds creatively as a visual metaphor for alternative modes of perception. My favourite is a wonderful VR experience called Notes on Blindness which accompanied the film of the same name. The film and VR experience tell the story of Philosopher John Hull who recounts the gradual deterioration and loss of his sight in an inspiring and uplifting audio diary of his experiences. Another example was In The Eyes of the Animal which places the user in an immersive audio visual experience as one of four animals exploring a forest. Finally, Where the City Can’t See is a speculative film by Liam Young and Tim Maughan which was shot entirely with laser scanners and proposed to depict the near future city as seen ‘through the eyes of the robots that manage it’.

I started working with the package after attending a workshop by the Bartlett scanning group B-Scan in 2017. Dominik Zisch in particular was great at suggesting ways I might by change the code to meet my aims. There are still lots of features and small touches I’d like to add when I have the opportunity. While my changes aren’t yet ready for the asset store, I do hope to have some of them incorporated in the near future. In the meantime you are free to clone or download my fork of the repository and experiment with the updates. Have fun!

Living With A Digital Twin: CASA Research into IoT technologies at Here East on the Olympic Park

Last week as part of the final project for my PhD I completed the installation of a network of eighteen environment sensing devices at UCL’s Here East campus on the Queen Elizabeth Olympic Park.

The custom built devices have been donated to this project by the Intel Collaborative Research Institute (ICRI). For the next four months each device will be measuring temperature, humidity, air pressure and ambient light levels at different throughout the Here East Campus on a minute-by-minute basis.

Each of the sensor devices is connected to the internet and participates in the Internet of Things (IoT) by transmitting the data they collect to a cloud-based platform that aggregates it for further analysis. That data will simultaneously be visualised in real-time in a dynamic 3D model or ‘Digital Twin’ of the Here East campus. In this way changes in the state of the building’s internal environment will be mirrored, in the instant they occur, by corresponding changes in the site’s 3D digital twin.

The technology has direct application for building and facility managers who want the ability to monitor the environmental conditions of the sites they operate in real-time. In this project we attempt to take the technology further and make it more participatory by opening up the digital twin system to other building occupants.

To this end the digital twin at Here East is being augmented with openly available data relating to the site’s wider physical and social context. In addition live data feeds from the internal sensors, the digital twin will also incorporate information on external environmental conditions and interactions via social media. As the study proceeds further feeds of information can be added as required.

In the coming weeks the digital twin will be made available online. Visitors to the site will also be able to interact with the sensors more directly using their mobile phones with the aid of beacon technology installed in each of the sensor devices. Efforts are also being made to open the data to interested researchers.

The objectives of the project are:

  • To operationalise the use of IoT and Digital Twin technologies in the built environment
  • To understand how building occupants and visitors interact and engage with IoT
  • To explore and asses methods for visualising and interacting with sensor data and IoT systems in real-time

If you wish to read more about the project a paper I presented at the GISRUK 2018 conference is available for download here.

Authors: Oliver Dawkins, Adam Dennett, Andy Hudson-Smith, all authors from the Bartlett Centre for Advanced Spatial Analysis University College London WC1E 6BT.

Note: This blog post has been cross posted on the CASA website news pages here.

TFL JamCam Video Feeds Integrated into CASA ViLo

For a number of years TfL have been providing open access to feeds from over 170 traffic cameras or ‘JamCams’ distributed at key locations across London’s road network. In addition to static images each camera also provides a five second video which is updated every 5 minutes. The feeds of these videos have now been incorporated into CASA’s ViLo platform.

I’d been fascinated by the videos for some time. Every morning when I arrive at CASA I check out CASA’s London CityDashboard which we have on in our reception area. The dashboard includes two static images from the cameras chose at random along with a looped video feed from another in the top right.

I was always struck by the sense of ground truth the cameras seemed to offer for a particular place. At the same time I was frustrated by the fact that I couldn’t get a sense of the wider context: What’s just out of shot? What’s the wider context in which each camera is situated? What’s going on over at the next nearest camera and the rest in the surrounding area Incorporating the feeds from those cameras into ViLo provides a spatialised sense of context in a way that the dashboard can’t. The 3D models also help users understand the orientation of each camera in a way that a map might not. Finally their incorporation in ViLo also facilitates comparison with other spatialised streams of data data.

By comparison with other real-time feeds like TfL’s real-time bus information the traffic cameras provide a much richer sense of what is happening in an area, at least within the five minute time scale provided by the video updates. Not only do we get a sense of the flow of traffic and any blockages, the information provided by the cameras also provides a wider situational awareness of factors like local weather conditions and pedestrian footfall. In this way the information they provide offers a degree of validation to other data sets that can be particularly useful when additional context is required for decision making by city officials and members of the public alike.

Thanks to Oliver O’Brien and Steven Gray for providing access to the TFL Traffic Cam data via CityDashboard the Big Data Toolkit.


Roames: Virtual Asset Management With Unity

Roames is a Unity-based 3D data visualisation platform created by Dutch company Fugro for the purpose of asset management. In particular it has been used to visualise LiDAR point clouds as the basis for the management and maintenance of power networks. In the video below Glen Ross-Sampson and Peter O’Loughlin from the Fugro Roames team discuss the challenges involved in creating a platform for geospatial data in Unity.

Behind the scenes Amazon Web Services (AWS) are used to provide scalable computation for processing large amounts of point cloud data. Algorithms are run on the AWS clusters to classify and extract different types of features from the point cloud. These include power lines, poles, vegetation and buildings. Further business rules can then be applied and visualised to help users make decisions. In this case they helped Ergon Energy in Australia assess the risk of damage to overhead power cables caused by growing vegetation. The benefit of this kind of ‘virtual asset management’ is that it allows clients like Ergon to make assessments about the assets they manage without having to send crews to inspect every site. By prioritising those sites most at risk they can expect to make significant savings.

Roames was the outcome of a five year project. Unity was chosen as the visualisation client because commercial GIS software didn’t provide the performance they required. They also wanted to be able to customise the interface and experiment with simulation. Using Unity enabled the team to prototype without having to build low level functionality from scratch.

The system allows the user to explore the scene in real-time. Data are streamed in to the scene and unloaded dynamically with the aid of memory and hard-disk caches. Changing level of detail (LOD) is used to support zooming the view from out of space all the way in to a ground level view. As the user zooms in points are replaced by a voxel representation. All of this is achieved using Amazon S3 for cloud storage.

As well as discussing the motivation behind Roames’ and their technical stack the talk does a great job of discussing some common problems and solutions in working with large spatial data sets in Unity.

Technical notes:

Regionation – Map data in Roames is structured according to the Tile Map Service (TMS) specification developed by the Open Source Geospatial Foundation (OSGeo) and served via a Rest API endpoint. Tiles of different LOD are provided based on proximity to the camera. This is also used when the camera is tilted to ensure lower levels of details are used for objects that are further away.

Floating Point Precision – Unity using 32-bit single precision floating point numbers to store the positions of assets. This gives an average accuracy to 7 significant figures. The need to map data across the whole globe to millimeter precision. However, on the scale of the globe accuracy to the nearest metre alone requires 8 significant figures. The spatial uncertainty this introduces is visibly represented by an onscreen spatial jitter. This was resolved by storing the positions of objects with 64-bit double precision and using a floating origin. The floating origin was achieved by setting the position of the main camera to the Unity world origin (0,0,0) each frame and moving the other objects relative to that position rather than moving the camera.

Manipulating large numbers of objects – Manipulating the positions of thousands of objects is computationally expensive and reduces the frame rate. The Roames team used a number of evenly distributed empty game objects or ‘terminal nodes’ as references that other objects could be parented to. This meant Instead of updating the positions of all objects in the scene they just had to update those of the terminal nodes.

Memory Management – As objects are loaded and removed from the scene their are spikes in activity caused by lags in Unity’s automated memory management or ‘garbage collection’; the process by which unused memory is freed for reuse. These issues were resolved by reusing existing objects to avoid allocating more memory and making those objects static where possible. Use of for loops or enumerators was recommended over foreach loops which allocate memory internally. Reducing the amount of string manipulation is also recommended.

Scratch Arrays – Roames introduced their own ‘Scratch Array’ pattern to resuse commonly sized arrays.

Binary Formats – Rather than use KML which is a verbose, text-based XML format, Roames uses the Binary PLY format which performs much better. This reduced file sizes and improved load times and garbage collection allocations.

In order to display the points efficiently they are batched into single meshes on 65,000 vertices. They also lower the density of their clouds prior to loading.

The Core Engine and the other aspects of the product like the user interface were separated to make the project easier to handle. This enabled the 14 developers on the project to work more efficiently. It also meant that other custom tools could be quickly developed in separation from the main project.

The team’s goals going forward to get the product working across the web, to open the Core API to developers, and to start using Unity physics for simulations.

A/B: Participatory Navigation with Augmented Reality

Imagine navigating the city with an augmented reality app, but where the choice of route is determined by a crowd and the decision floats in front of you like the hallucinations of a broken cyborg. A/B was an experiment in participatory voting, live streaming and augmented reality by Harald Haraldsson. Created for the digital art exhibition 9to5.tv the project allowed an online audience to guide Haraldsson around Chinatown in New York for 42 minutes. This was achieved through a web interface presenting the livestream from an Android Pixel smartphone.

The smartphone was running Haraldsson’s own augmented reality app implemented with the Unity game engine and Google’s ARCore SDK. At key points Haraldsson could use the app to prompt viewers to vote on the direction he should take, either A or B. ARCore enabled the A/B indicators to be spatially referenced to his urban surroundings in 3D so that they appeared to be floating in the city. Various visual effects and distortions were also overlaid or spatially referenced to the scene.

More images and video including a recording of the the full 45 minute can be found on the A/B project page here.

Thanks to Creative Applications for the link.

ViLo and the Future of Planning

Following our recent posts on CASA’s digital urban visualisation platform ViLo, the Future Cities Catapult who collaborated with CASA on the project have released a video discussing it in further detail. Commencing in 2014 the aim of the project was to identify which combinations of urban data might be most valuable to urban planners, site operators and citizens. CASA research associates Lyzette Zeno Cortes and Valerio Signorelli discuss how it was created using the Unity game engine in order to understand its potential for visualising information in real-time.

Ben Edmonds from the London Legacy Development Corporation who run the Queen Elizabeth Olympic Park where ViLo has been tested discusses how this was used to gather environmental data and qualitative data from park visitors in order to help understand and improve their experience of the park. Including real-time information on transportation links, environmental factors and park usage by the public helps to build up an overview of the whole area so that it can be run more effectively.

Beyond this there is an expectation that use of the 3D model can be extended beyond the Olympic Park and implemented London-wide. This fits in to a wider expectation for City Information Modelling (CIM). As Stefan Webb from the Future Cities Catapult describes it, this is the idea that a 3D model containing sufficient data can enable us to forecast the impact of future developments and changes to the functioning of both the physical and social infrastructure of the city.

Digital Literacy in the context of Smart Cities

September 8th is UNESCO’s International Literacy Day. This year the theme is ‘Literacy in a digital world’:

At record speed, digital technologies are fundamentally changing the way people live, work, learn and socialise everywhere. They are giving new possibilities to people to improve all areas of their lives including access to information; knowledge management; networking; social services; industrial production, and mode of work. However, those who lack access to digital technologies and the knowledge, skills and competencies required to navigate them, can end up marginalised in increasingly digitally driven societies. Literacy is one such essential skill.

Just as knowledge, skills and competencies evolve in the digital world, so does what it means to be literate. In order to close the literacy skills gap and reduce inequalities, this year’s International Literacy Day will highlight the challenges and opportunities in promoting literacy in the digital world, a world where, despite progress, at least 750 million adults and 264 million out-of-school children still lack basic literacy skills.

International Literacy Day is celebrated annually worldwide and brings together governments, multi- and bilateral organizations, NGOs, private sectors, communities, teachers, learners and experts in the field. It is an occasion to mark achievements and reflect on ways to counter remaining challenges for the promotion of literacy as an integral part of lifelong learning within and beyond the 2030 Education Agenda.

In the past days I’ve been preparing for a conference talk this weekend and its has become clear to me that digital literacy is of key importance for helping individuals to engage with urban technologies and exercise digital agency. It is through digital literacy that people living in cities will be able to understand and make informed decisions with regard to the use and impact of emerging technologies. Smartphones, the Internet of Things, driverless cars, drones, artificial intelligence and automation can be very daunting and their implications unclear.

A common response to the perceived imposition of digital technologies is to try to disconnect. It is up to the individual to determine to what extent they engage with such technologies. However, ignoring these technologies altogether is no solution. At the very least we have to provide the opportunity for those that are sufficiently capable to be able to inform themselves, enabling them to more effectively assess the advantages and disadvantages of different technologies. We need to move away from the kind of binary thinking that leads to an all or nothing approach to technology. Fostering digital literacy is key for helping individuals and communities negotiate lives that are increasingly mediated by digitally technologies.

At the conference on Monday afternoon I’ll be presenting my paper ‘Opening Urban Mirror Worlds: Possibilities for Participation in Digital Urban Dataspaces’. In this talk I’ll discuss some of the ways in which technologies like virtual and augmented reality might be used to give people access urban data. I’ll also be part of a panel discussing ‘Engagement in the Smart City’. Further details can be found on the conference website: Whose Right To The Smart City.

Microsoft’s Vision for Mixed and Mixing Realities

A couple of days ago the RoadtoVR website posted about Microsoft’s parent for a wand like controller which appeared in the concept video above. I thought it was worth re-posting the video here as it provides a good indication of what a mixed reality future might look like. In particular it considers a future where augmented and virtual reality systems are used side by side. Where some companies firmly backed one platform or the other, VR in the case of Oculus and the HTC Vive, AR in the case of Meta, more established companies like Microsoft and Google have the resources and brand penetration to back both. Whether Apple follows suite or commits everything to AR following the recent release of ARKit remains to be seen. As such it is interesting to compare the kind of mixed reality ecosystems they want to create. Its then up to developers and consumers to determine which hardware, and by extension which vision, they are most inclined to back.

There are many challenges to overcome before this kind of mixed reality interaction becomes possible. The situated use of AR by the character Penny, and use of VR for telepresence by Samir are particularly well motivated. But what are the characters Samir and Chi actually going to see in this interaction? Will it make a difference if they don’t experience each other’s presence to the same degree? And, how is Samir’s position going to be referenced relative to Penny’s? There are many technical challenges still to be overcome, and compromises will need to be made. For companies like Microsoft and Google the challenge for them is in convincing developers and consumers that the hardware ecosystem they are providing is sufficiently close to their vision of that mixed reality future today…and crucially all at the right price.

Nature Smart Cities: Visualising IoT bat monitor data with ViLo

In the past weeks I’ve been collaborating with researchers at the Intel Collaborative Research Institute (ICRI) for Urban IoT to integrate data from bat monitors on the Queen Elizabeth Olympic Park into CASA’s digital visualisation platform, ViLo. At present we are visualising the geographic location of each bat monitor with a pin that includes an image showing the locational context of each sensor and a flag indicating the total number of bat calls recorded by that sensor on the previous evening. A summary box in the user interface indicates the total number of bat monitors in the vicinity and the total number of bat calls recorded the previous evening. Animated bats are also displayed above pins to help users quickly identify which bat monitors have results from the previous evening to look at.

The data being visualised here comes from custom made ‘Echo Box’ bat monitors that have been specifically designed by ICRI researchers to detect bat calls from ambient sound. They have been created as part of a project called Nature Smart Cities which intends to develop the worlds first open source system for monitoring bats using Internet of Things (IoT) technology. IoT refers to the idea that all sorts of objects can made to communicate and share useful information via the internet. Typically IoT devices incorporate some sort of sensor that can process and transmit information about the environment and/or actuators that respond to data by effecting changes within the environment. Examples of IoT devices in a domestic setting would be Philips Hue Lighting which can be controlled remotely using a smartphone app, or Amazon’s Echo which can respond to voice commands in order to do things like cue up music from Spotify, control your Hue lighting or other IoT devices, and of course order items from Amazon. Billed as a ‘”shazam” for bats’ the ICRI are hoping to use IoT technology to show the value of similar technologies for sensing and conserving urban wildlife populations, in this case bats.

Each Echo Box sensor uses an ultrasonic microphone to record a 3 second sample of audio every 6 seconds. The audio is then processed and transformed into an image called a spectrogram. This is a bit like a fingerprint for sound, which shows the amplitude of sounds across different frequencies. Bat calls can be clearly identified due to their high frequencies. Computer algorithms then analyse the spectrogram to compare it to those of known bat calls in order to identify which type of bat was most likely to have made the call.

The really clever part from a technical perspective is that all of this processing can be done on the device using one of Intel’s Edison chips. Rather than having large amounts of audio transmitted back to a centralised system for storage and analysis, Intel are employing ‘edge processing’, processing on the device at the edge of the network, to massively reduce the amount of data that needs to be sent over the network back to their central data repository. Once the spectrogram has been produced the original sound files are immediately deleted as no longer required. Combined with the fact that sounds within the range of human speech and below 20kHz are ignored by the algorithms that process the data, this ensures that the privacy of passersby is protected.

This is a fascinating project and it has been great having access to such an unusual data set. Further work here can focus on visualising previous evenings data in time-series to better understand patterns of bat activity over the course of the study. We also hope to investigate the use of sonification by incorporating recordings of typical bat calls for each species in order to create a soundscape that complements the visualisation and engages with the core sonic aspect of study.

Kind thanks to Sarah Gallacher and the Intel Collaborative Research Institute for providing access to the data. Thanks also to the Queen Elizabeth Olympic Park for enabling this research. For more information about bats on the Queen Elizabeth Olympic Park check out the project website: Nature Smart Cities.

NXT BLD: Emerging Design Technology for the Built Environment

NXT BLD is a new conference in London specifically aimed at the discussion on emerging technologies and their applications in the fields of architecture, engineering and construction. Organised by AEC Magazine, the first event was held in the British Museum on the 28th of June 2017. Videos of the event presentations have been released and provide some useful insight into the ways in which technologies like VR are being used within industry. I found the following talk by Dan Harper, managing director of CityScape Digital, particularly useful:

In the video Dan discusses the motivation for their use of VR. Focused on architectural visualisation the company often found that the high quality renderings they were producing quickly became outdated due to the fact that render times were not keeping pace with the iterative nature of the design process. They found that the real time rendering capabilities of game engines, in their case Unreal, helped them iterate images more quickly. Encountering similar challenges with the production of 3D models they realised that having clients inspect the 3D model could be used not only for communication but also as a spatial decision making tool. Supported by 3D data, real-time rendering and VR, which provides a one to one scale experience of the space, value can be added and costs saved by placing a group of decision makers within the space they are discussing rather than relying on the personal impressions each would draw from their own subjective imagining  based on 2D plans and architectural renderings.

Innovation of the design process with VR not only makes it less expensive but also makes the product more valuable. With reference to similar uses of VR in the car industry Dan identifies opportunities for ‘personalisation’, ‘build to order’, ‘collaboration’, ‘focus grouping’ experientially, ‘efficient construction’ and ‘driving margins at point of sale’. Case studies include the Sky Broadcasting Campus at Osterley, the Battersea Power Station redevelopment and the Earls Court masterplan. These use cases demonstrate that return on investment is increased through reuse of the 3D models and assets in successive stages of the project from concept design, investor briefings, stakeholders consultation right through to marketing.

Videos of the other presentations from the day can be found on the NXT BLD website here.